In September 2021, RESTEC launched VEGA (Visualizing Earth tool by Google Earth Engine Apps). VEGA is a free-of-charge tool that allows users to search and display satellite imageries on a screen without any registration or difficult code entry. VEGA aims to make it easy for beginners who are interested in exploring satellite imageries but do not know where to start.
We spoke with two RESTEC’s members at Solutions Division 2 who designed and developed VEGA to find out what went on behind the scenes.
Profile
 Ryo Michishita (Ph.D.)
Deputy Manager, Research and Promotion Section, Solution Business Department 2
VEGA designer and developer. He engages in capacity building and user relationship-building activities to promote satellite data utilization. He also teaches basic remote sensing courses, optical remote sensing courses, and remote sensing courses using Google Earth Engine.
 Pegah HASHEMVAND Khiabani (Ph.D.)
Earth Observation and Geo-spalital Researcher, Research and Promotion section, Solutions Business Unit 2
VEGA developer. Geospatial and remote sensing export. She engages in several projects including research, development, and dissemination of the latest terrestrial applications of optical remote sensing using Google Earth Engine in collaboration with various foreign research institutes and agencies.
Please tell us about the background of VEGA development.
Ryo Michishita (Michishita) : Two main backgrounds led us to develop VEGA. The first background was the advent of the Google Earth Engine (GEE). Previously, to obtain and view satellite data, you had to go to the Earth Explorer of the U.S. Geographical Survey for Landsat-8 (USGS), or the Copernicus Open Access Hub of the European Space Agency or the EO Browser for Sentinel-1 and Sentinel-2 to access, analyze and display the data. You were also required to prepare your own computer and software, which was a very tedious task. However, with the advent of GEE, satellite data can be easily accessed by typing a code script in the code editor of a web browser, and a variety of satellite data can be searched, obtained, analyzed, and displayed in a single environment, making it very convenient. However, GEE is still difficult to be used by people who don’t have programming skills, and people still feel that satellite data is not freely available.
That is why we wanted to find a way to make it easier for those people to take the advantage of freely available satellite data in the GEE environment. I knew that it was possible to create a tool for viewing images using a Graphical User Interface (GUI) in GEE, and I had learned the basic techniques in a session on how to create one at GEE’s User Summit held a few years ago. In the spring of 2020, I started to think about the possibility of using this technology to create a tool for viewing satellite data with a minimum of functionality and easy to use for everyone.
The second background was the training aspect. In Remote Sensing Basic Course *1, in which the majority of applications are learning remote sensing for the first time, the ultimate goal for the trainees is to acquire satellite data reading skills, however, in most of the cases the trainees’ questions tend to concentrate on how to operate GIS tools used in the course, and the time spent on answering these questions is inevitable. At the same time, the new coronavirus epidemic forced us to switch our face-to-face courses to an online format. We came to realize that if we were to replace the face-to-face course with an online course, we would spend too much time explaining how to use the GIS tools and not enough time learning how to read images.
So we decided to develop a GEE application tool that would allow basic learners to understand how to search, obtain, analyze and display satellite data in a simple way. However, when I started to design the GUI, I was confronted with several technical problems and spent many days asking my colleagues if they could help me. It was then that Pegah came to my rescue. I knew that Pegah often used GEE for analysis, but this was her first time developing an app, so I asked her to help me learn.
Pegah HASHEMVAND Khiabani(Pegah) : I made my first advanced GEE app with the idea coming from Mr. Michishita. VEGA is a visualization tool that is easy to use and helps to visually understand satellite data for those who want to learn the basics of remote sensing. VEGA is also an easy tool in a way that there is no requirement for GEE user registration or downloading the data. In the beginning, we weren’t sure how to design the app, but thanks to our multiple meetings and discussions, we figured out the best possible design and functions with a user-friendly interface hiding a tremendous amount of processing in the back end of showing the images.
Michishita : That’s right. To make it easier to understand, in VEGA, users can use three different products: two Landsat-8 products and one Sentinel-2 product, and users can then display them on the same screen and compare them immediately without downloading each satellite data.
Pegah : Another feature in VEGA that is worthy to mention is that you can see the entire globe, so it’s easy to focus on a specific area. When we first developed VEGA, we wanted it to be available only in the Japan area, but after some discussion, we decided to expand the scope to cover the whole planet. By doing so, it is now possible to view data from any location in the world without downloading the data while in conventional methods normally, if you want to look at different parts of the world, you would have to download the data for each location, but this inconvenience is not present in VEGA, so I think you can feel the fun of remote sensing as it is.
Michishita : I hope that VEGA will be an opportunity for people who have never been interested in remote sensing to use satellite data. It has long been said that the three main characteristics of satellite data are that the observations can be used (1) at almost the same time, (2) over a wide area, and (3) with repeated cycles. We hope that people will enjoy using satellite data to the fullest and that it will help them to use it to solve their own problems in the future. We want people to use VEGA as a toy. We hope that people will use VEGA in ways that we haven’t thought of yet. We want people to use the VEGA and let their imaginations run wild with what solutions they can come up with.
 Mt.Fuji in Autumn
What can you do with VEGA?
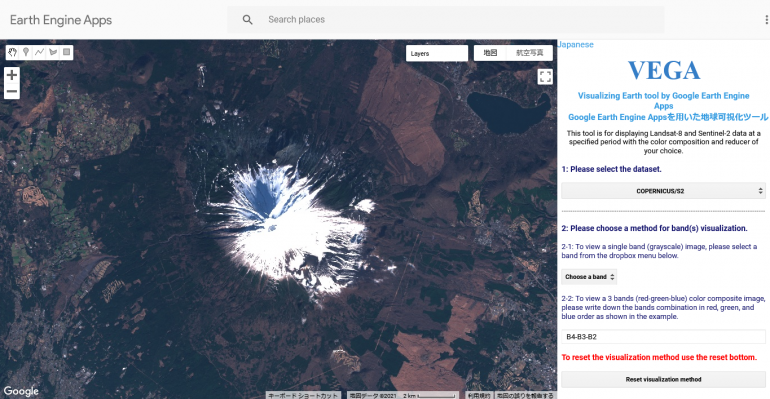
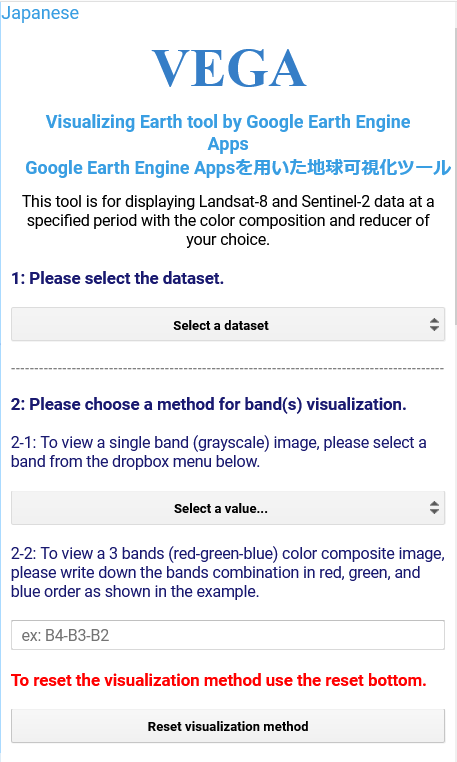
Michishita : First you have to choose between the available datasets (Landsat-8 and Sentinel-2 data). Then you need to specify the period of the observation. For example, if you want to see images from spring and early summer of this year, you can enter the time the starting and ending date. Then it is possible to choose and apply different functions to the images such as selecting the oldest or the latest date of observation, the median, maximum, and minimum value of pixels. If you have set all the requirements and nothing is displayed, you can change the settings for the period, etc. in small increments and re-display. With traditional software, changing these settings little by little is tedious, but we are proud of the fact that with VEGA users can change and display all the settings on one screen in the browser with almost no effort.
To give you a better picture of VEGA, there are 5 sections in the panel: (1) data selection, (2) display method (grayscale or color composite) and band selection, (3) display level setting, (4) observation period setting, (5) data composite method (latest/median, etc.) selection. All you have to do is set these settings and click on the Display button. Each of these items is explained in detail in the lectures and practical sessions of the “Basic Remote Sensing Course” held online, so the students can use VEGA after understanding how it works.
Pegah : I’d like to also add that, VEGA has a function where you can click on a point on the map, and the latitude, longitude, and pixel values for each band will be displayed in the bottom right corner of the screen. With this function, you can guess, for example, that this pixel in the near-infrared band is bright because the plants are active, and that the pixel a little further away is dark because the plants are not active, just by clicking on it. The date the image was taken is also available for each pixel, so you can make a note of when you did the color composite. These functions were previously done by launching a tool in the previous software, but with VEGA we have made it easy for the user to use them by simply clicking on the map.
What was the most difficult part?
 VEGA operating screen
Michishita : There were some features that we wanted to include, but we found that we couldn’t build them into GEE’s specifications, so we went through a lot of trial and error. For example, the existence of clouds. We wanted to get as close to that as possible, but in reality, it doesn’t work because of the satellite cycle and cloud cover. After much debate, we decided to leave the option to combine images with a set time period, so that people can learn that you can only get a cloud-free image of the area if you search for it.
The other challenge was to set the maximum and minimum pixel values to be displayed, which is something that an experienced satellite image analyst will be able to do by looking at the histogram of pixel values. We have tried to allow the user to enter their own values in the text boxes to learn by trial and error how to set them up to get the best results. If we wanted to include a lot of complicated functions, we could have done it, but we wanted to make it easy to use for people who don’t have background knowledge of satellite data, so we designed it to be as simple as possible.
Pegah : As Mr. Michishita has already mentioned, one of the things we often discussed during the development stage was how to create a simple User Interface (UI) with GEE’s functions for users who have no knowledge of remote sensing. For example, the decision on the order of setting items was not easy. In the final VEGA version, the items are listed from top to bottom are in a way to make it easier to select and configure settings step-by-step. The VEGA setting order is not the same as what we often see in other satellite data search and retrieval platforms, which will be helpful by remote sensing beginners to better understand the other platforms such as USGS Earth Explorer and Copernicus Open Access Hub. So we hope that this will make it easier for people to move on to the next step.
I’ve been analyzing satellite imagery for a while now, but I’ve never worked on an app before, so thinking about UX, UI and what users want was a big challenge for me. I learned a lot from sharing techniques and discussing a lot with Mr. Koide and Mr. Michishita, who are lecturers of “Remote Sensing Course using Google Earth Engine“, as a team.
Who would you like to use it for?
Pegah : The most important end-user I had in mind was school teachers. The VEGA is a free-of-charge tool and does not require any resources other than a computer and internet connection, so novice students can easily use it. Although VEGA ultimately was designed for those with no basic remote sensing knowledge, I would like to see experienced remote sensing exports also trying it out.
How do we use VEGA?
Pegah : VEGA is really a user-friendly tool. You don’t need user registration. You can use it whenever you want by referring the user manual. Anyone can start using it right after following the procedure in the manual. But before you start, please remember that VEGA is an online application, so please make sure you have an internet connection and a computer.
Michishita : Yes, it’s really a simple tool and we want everyone to use it, regardless of whether they are in the education or data science industry, so please try it out and spread the word of VEGA.
VEGA is available here.
English version
Japanese version
*1 : The Remote Sensing Basic Course in English are available on onsite training.
